Intelligentpathcontrolforenergy-savinginhybridSDNnetworks(5)
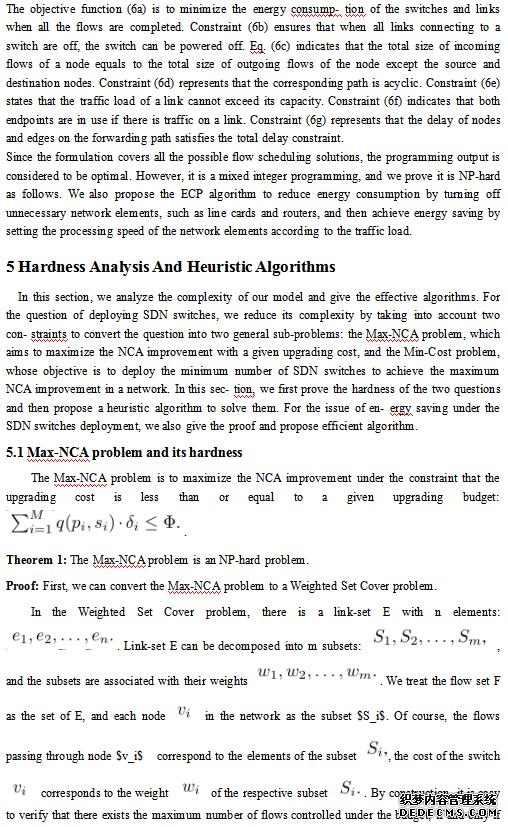
时间:2023-02-10 15:32 来源:网络整理 作者:采集插件 点击:次
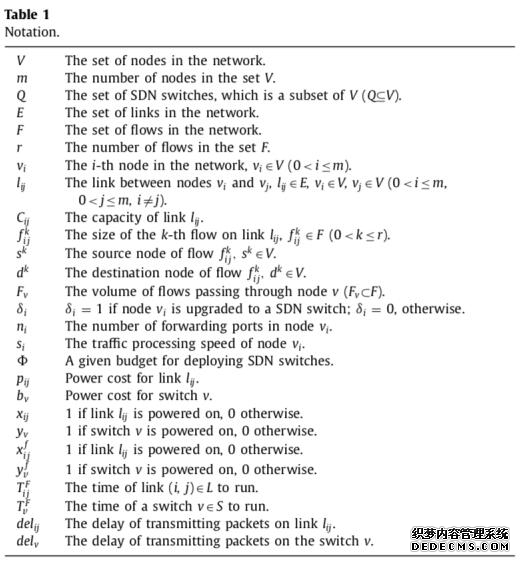
We formulate a network as a graph G= (V,E ), where V is the set of nodes, and E is the set of links. Let F denote the set of traffic flows. We use v_i to represent a node in the network, l_{ij} to represent the link between nodes v_i and v_j. Let C_{ij} denote the capacity of link l_{ij}, andf^k_{ij} (f^k_{ij}\in \mathcal{F}) be the size of the k-th flow on link l_{ij}. Let the source and destination nodes of flow f^k_{ij} be s^k and d^k. We use F_{v_i} to denote the set of flows passing through node v_i. The notations for this paper are listed in Table 1.
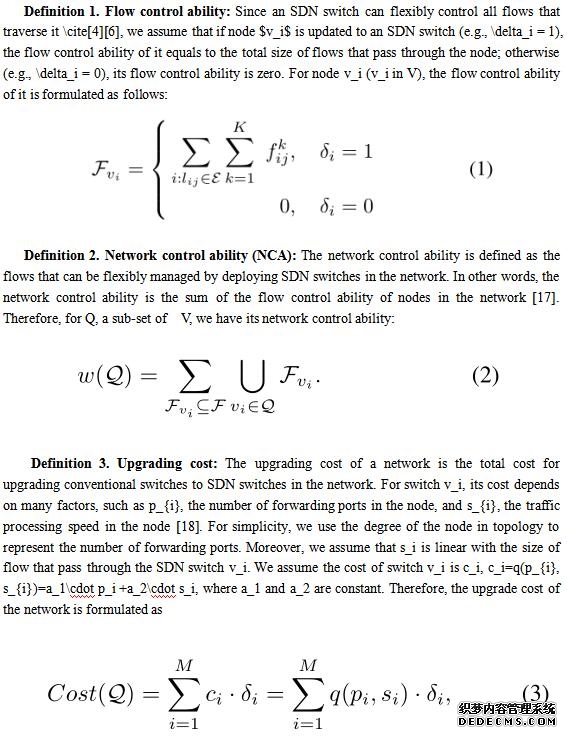
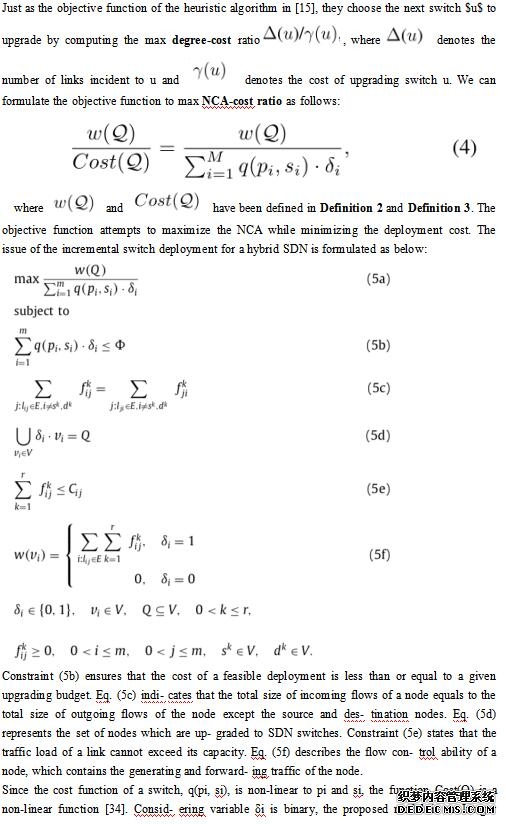
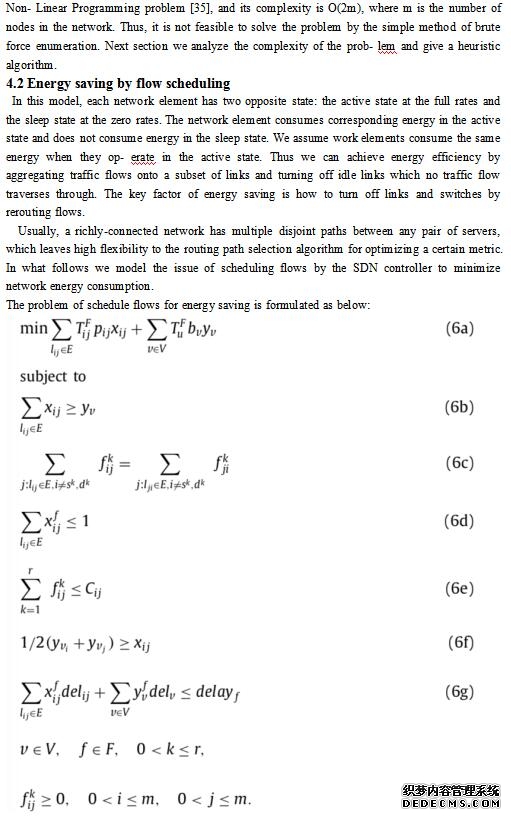
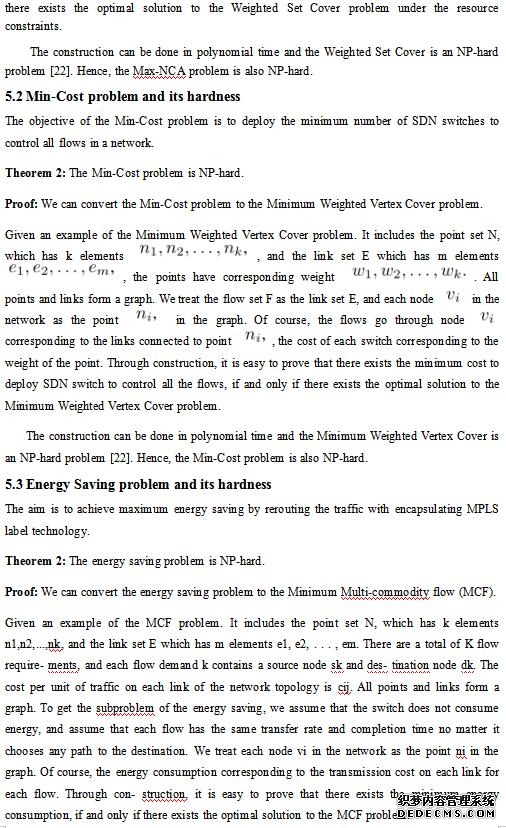
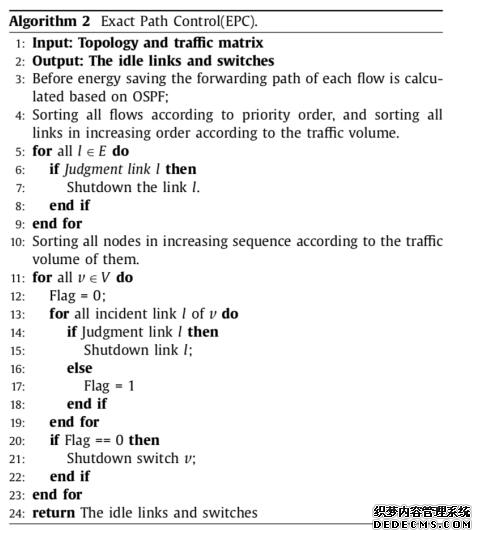
4.1 Deploying SDN switch to holding more flows Typically, the NCA of a network is associated with the number of controlled flows in the network. The SDN switch can flexibly control the flows in the networks. Then we improve the NCA by in- crementally deploying SDN switches. In [9], the authors show that the hybrid SDN network can achieve fast recovery and guarantee reachability from any single link failure if the flows pass through at least one designated SDN switch. In [21,32], the authors show that it becomes possible to operate the most of an enterprise net- work for every source-destination path that includes at least one SDN switch. Therefore, the links and switches can be turn off by flexibly rerouting the flows if they traverse at least one SDN switch in hybrid networks. To quantify the performance of a network, we introduce some definitions below:
6 Simulation In this section, we evaluate our solution against the baseline scheme in network topologies. The simulation results of the fol- lowing algorithms are compared with each other to evaluate the Algorithm 1. The Heuristic scheme is use Algorithm 1 to update nodes to SDN switches. The scheme Degree-first in [32] is to choose the switch v that has the maximum number of links incident to it- self, and then upgrade the switch. The scheme Random randomly selects nodes to upgrade to SDN switches in the network. In order to verify the effect of energy saving by the Algorithms 2 and 3, we compare the scheme EPC to the scheme PLSP [3] and the scheme EA-FA [4]. 6.1 Simulation setup In our simulation, we use two network topologies the ISP 1755 and the ISP 3967 from the Rocketfuel [37,38]. In networks, there may be no communication between some node pairs. Thus, we consider two cases. In Case 1, each node transmits flows to all other nodes, while in Case 2, only a part of node pairs communi- cate with each other. We can get network topologies and infer the link weights of each edge form Rocketfuel [38]. The traffic matrix is the data set obtained from the TOTEM [39] project and obtained by S. Uhlig [40]. 6.2 The flows that can be controlled We propose the Algorithm 1 to solve the problem that incre- mental deployment SDN switches in hybrid networks. Since the flows between node pairs are dynamically generated, and the size of each flow is also dynamic, we use the average control flow num- ber as the experimental parameter [41]. We use σ to indicate the percentage of the controlled flows. 6.2.1. Case 1: flows between all nodes. Fig. 5 shows the results of the problem Max-NCA in ISP 1755 and ISP 3967. Among the three schemes, Random performs the worst. In Fig. 5(a), Random requires 14% cost to improve 55% of σ, while Heuristic needs only 2% cost. Heuristic needs only 10% cost to realize 98% of σ improvement. The advantage of the heuris- tic is obviously better than the Degree-first when the percentage of upgrading cost is less than 8% in Fig. 5(a) or less than 14% in Fig. 5(b). The performance of the heuristic algorithm is best be- cause it first chooses the core node with maximum flow to up- date. Seen from Fig. 5(b), the results of Heuristic also outperform Random and Degree-first. Comparing Fig. 5(a) with Fig. 5(b), we can conclude that with the extending of the network scale, Heuristic’s advantage is more apparent than Random and Degree-first. 6.2.2. Case 2: flows between certain node pairs. (责任编辑:admin) |